Weights & Biases (W&B) is not just a logging tool—it’s a robust platform that makes your machine learning experiments organized, reproducible, and visually compelling. In this article, we dive deep into how W&B enhances data visualization while briefly exploring its other capabilities, including artifact management, hyperparameter sweeps, and collaborative experiment tracking.
Why Experiment Tracking Matters
When I first sat down at my computer—logging into Kaggle with no clear way to track my experiments—I was overwhelmed by the chaos. With W&B, every run is stored under a project, making it easy to recall what you did and compare different configurations side by side.
The transcript explains that every time you run wandb.init, you create a run that’s stored in a project. This means that all your experiments can be viewed together, with configurable filters and sorting options that let you quickly pinpoint the best-performing models.
Getting Started with W&B
Logging In and Initialization
The first step is to log into W&B. The code below shows how to retrieve your API key from an environment variable and initialize a run:
import os
import wandb

api_key = os.environ.get("WANDB_API_KEY")
if api_key is None:
    raise ValueError("WANDB_API_KEY environment variable is not set.")
wandb.login(key=api_key)

wandb.init(project="mnist-tf", config={
    "learning_rate": 0.001,
    "epochs": 12,
    "batch_size": 128,
})
Tracking Runs and Configuration
Every run automatically captures configuration parameters—such as learning rate, batch size, and the number of epochs—and logs them alongside your metrics. This allows you to revisit any experiment and know exactly what settings were used.
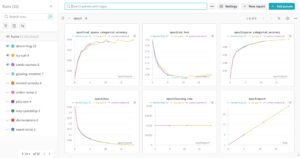
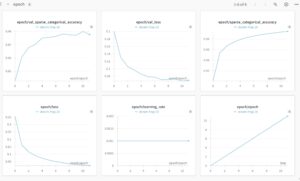
Visualizing Metrics and Performance
One of the core features of W&B is its ability to create interactive visualizations of your training and validation metrics. In our MNIST example, we use the following code to log metrics and save our model checkpoints:
import tensorflow as tf
import tensorflow_datasets as tfds
from wandb.integration.keras import WandbMetricsLogger, WandbModelCheckpoint

def load_and_preprocess_data(batch_size=128):
    (ds_train, ds_test), ds_info = tfds.load(
        'mnist',
        split=['train', 'test'],
        shuffle_files=True,
        as_supervised=True,
        with_info=True,
    )
    def normalize_img(image, label):
        return tf.cast(image, tf.float32) / 255., label
    ds_train = ds_train.map(normalize_img, num_parallel_calls=tf.data.AUTOTUNE)
    ds_train = ds_train.cache().shuffle(ds_info.splits['train'].num_examples)
    ds_train = ds_train.batch(batch_size).prefetch(tf.data.AUTOTUNE)
    ds_test = ds_test.map(normalize_img, num_parallel_calls=tf.data.AUTOTUNE)
    ds_test = ds_test.batch(batch_size).cache().prefetch(tf.data.AUTOTUNE)
    return ds_train, ds_test, ds_info

def create_model():
    model = tf.keras.models.Sequential([
        tf.keras.layers.Flatten(input_shape=(28, 28, 1)),
        tf.keras.layers.Dense(128, activation='relu'),
        tf.keras.layers.Dense(10)
    ])
    model.compile(
        optimizer=tf.keras.optimizers.Adam(wandb.config.learning_rate),
        loss=tf.keras.losses.SparseCategoricalCrossentropy(from_logits=True),
        metrics=[tf.keras.metrics.SparseCategoricalAccuracy()]
    )
    return model

def main():
    ds_train, ds_test, ds_info = load_and_preprocess_data(batch_size=wandb.config.batch_size)
    model = create_model()
    model.fit(
        ds_train,
        epochs=wandb.config.epochs,
        validation_data=ds_test,
        callbacks=[
            WandbMetricsLogger(),
            WandbModelCheckpoint("models.keras")
        ]
    )
    wandb.finish()

if __name__ == '__main__':
    main()
This code not only trains a model on MNIST but also logs metrics and saves checkpoints, which then appear in the W&B UI as interactive plots. You can easily compare runs, check for overfitting, and even sort runs based on performance metrics.
Beyond Metrics: Artifacts, Sweeps, and More
The transcript dives deeper into other W&B features that extend beyond basic logging:
Artifacts
Artifacts in W&B let you version datasets, models, and other important files. In the video, the narrator explains how you can log datasets (like the Titanic dataset) and model artifacts. This way, you can track changes, revert to previous versions, or share your data easily.
Sweeps for Hyperparameter Optimization
W&B’s sweeps allow you to automatically explore different combinations of hyperparameters with minimal code changes. The transcript details how a sweep config can be set up and how runs are grouped based on different configurations.
Interactive Tables and Advanced Visualizations
For advanced analysis, W&B supports interactive tables where you can log custom data—such as predictions versus actual outcomes. This is particularly useful when analyzing performance across different data segments.
Conclusion
Weights & Biases has transformed the way we handle machine learning experiments. By providing a platform that is both feature-rich and easy to use, it allows you to focus on building models rather than managing experiments manually. Its powerful data visualization capabilities—combined with features like artifact management, sweeps, and interactive tables—make it a must-have tool for anyone serious about machine learning.
Check out my GitHub repository for more details and to explore additional data visualization examples. There, you’ll also find other samples that demonstrate different visualization techniques with W&B.
Feel free to download the source code. [edit] I’m moved all the code of my blog posts on my GitHub
Happy experimenting, and enjoy visualizing your data like never before!