Matplotlib is a cornerstone in the data science toolkit. Whether you’re prototyping in Jupyter or preparing publication‐quality figures, its flexibility makes it indispensable. In this post, we’ll focus on the object‐oriented (OO) interface of Matplotlib—a style that grants you full control over your plots, especially when you need complex layouts or custom styling. (For a taste of what Matplotlib can do, check out the plot types gallery.)
Why the Object‐Oriented Approach?
Using Matplotlib’s OO API means you work directly with objects like Figure and Axes. This is particularly useful when you:
- Nest labels: Easily add overall titles or axis labels that span multiple subplots.
- Set axes properties: Use methods like
set_xlabelandset_ylabelon each axis. - Control resolution: Specify DPI to get high‐quality outputs.
- Customize appearance: Adjust colors, line widths, styles, and markers precisely.
- Save images: Export your visualizations to image files with your desired quality.
Let’s dive into these features with a practical example.
A Comprehensive Example
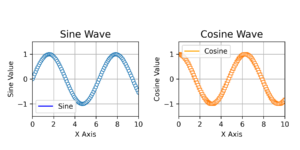
Attached you can download a complete Jupyter Notebook [edit]: I moved the sample on my GitHub repository, that will drive you through the creation of the chart below, step by step we will:
- Import Libraries and Plot Sine (Single Plot)
- Create a Figure with Two Subplots (Sine and Cosine Side-by-Side)
- Customize the Sine Subplot
- Plot the Sine Wave on the First Subplot
- Customize the Sine Subplot
- Plot the Cosine Wave on the Second Subplot
- Customize the Cosine Subplot
- Adjust Layout
- Save the Figure as a High-Resolution Image
That is the image below
Conclusion
Using Matplotlib’s object‑oriented interface empowers you to build complex, customizable plots with ease. By setting properties on specific objects (like Axes), you avoid the pitfalls of mixing stateful commands and create reproducible, high‑quality visualizations. Explore more of what Matplotlib can do through its extensive plot types gallery and let your data tell its story.