Deep-Dive: Debugging Python with PyCharm on macOS (Local & Docker) 🐍
If you’re working with PyCharm, Docker, and Python daily, your debugger is either your best friend or that powerful tool you know exists but haven’t fully mastered. This guide will change that.
This is a comprehensive technical guide to debugging Python applications with PyCharm 2025.2 Professional on macOS using Docker Desktop. We’ll cover:
- ✅ Local debugging with conda environments
- ✅ Remote debugging inside Docker containers
- ✅ Docker Compose-based debugging workflows
- ✅ Attaching to running containers with Python Debug Server
We’ll use a real-world FastAPI application (a DateTime API with timezone conversions and business hours logic) as our example throughout this guide.
Prerequisites
- macOS (Sonoma or later)
- Docker Desktop installed and running
- PyCharm Professional 2025.2+ (Community Edition has limited Docker debugging support)
- Conda/Miniconda installed
PyCharm Professional is required for Docker remote interpreters and Docker Compose integration. Community Edition doesn’t support these features in the same way.
1. Understanding PyCharm’s Debugging Architecture 🏗️
Before diving into configurations, let’s understand the three core components:
1.1 Python Interpreter
The Python environment that runs your code. This can be:
- Local: conda environment, venv, or system Python
- Remote: Docker container, Docker Compose service, SSH remote machine, or WSL
1.2 Run/Debug Configuration
A named recipe that specifies:
- Which script or module to run
- Which interpreter to use
- Working directory, environment variables, parameters
- Port mappings and path mappings (for Docker)
1.3 Debugger
PyCharm uses pydevd (Python Debugger Daemon), a powerful debugging engine that:
- Suspends program execution at breakpoints
- Allows you to inspect variables and call stacks
- Supports step-through debugging, watches, and expression evaluation
- Works seamlessly with both local and remote interpreters
In Docker scenarios, PyCharm either:
- Runs your code inside a container via a Docker-based interpreter with the debugger attached automatically, OR
- Attaches to a running process inside a container via
pydevd-pycharmandsettrace()
2. Local Debugging Setup: Getting the Foundation Right 🎯
First thing you need to clone the sample repo we will use, you can find it on my [GitHub] Let’s start with local debugging using conda. If this isn’t solid, Docker debugging will only amplify the pain.
2.1 Setting Up Your Conda Environment
Our example project includes an environment.yml file:
1
2
3
4
5
6
7
8
9
10
11
12
name: debugging-python
channels:
  - conda-forge
  - defaults
dependencies:
  - python=3.11
  - pip
  - pip:
      - fastapi==0.104.1
      - uvicorn[standard]==0.24.0
      - pydantic==2.5.0
      - pydevd-pycharm~=242.23726  # For remote debugging
Create the environment from your terminal:
1
2
# Navigate to project root
cd /path/to/DebuggingPython
1
2
# Create the conda environment
conda env create -f environment.yml
1
2
# Activate it
conda activate debugging-python
2.2 Configuring PyCharm to Use Conda
- Open your project in PyCharm
- Open Settings (
⌘,on macOS) - Navigate to Project: debugging-python → Python Interpreter
- Click the gear icon ⚙️ → Add Interpreter → Add Local Interpreter
- Select Conda Environment tab
- Choose Existing environment
- Navigate to your conda environments folder:
- Default location:
~/miniconda3/envs/debugging-python/bin/pythonor~/anaconda3/envs/debugging-python/bin/python
- Default location:
- Click OK
PyCharm will now use this interpreter for:
- Running and debugging
- Installing packages
- Code completion and inspections
2.3 Creating a Python Run/Debug Configuration
Never use “Run file in console” for serious debugging. Always create named configurations.
- Go to Run → Edit Configurations…
- Click + → Python
- Configure as follows:
Configuration Name: debugging-python-local
| Field | Value |
|---|---|
| Script path | Leave empty (we’ll use module) |
| Module name | uvicorn |
| Parameters | main:app --reload --log-level debug |
| Working directory | /path/to/debugging-python/src |
| Python interpreter | debugging-python (your conda env) |
| Environment variables | (empty for now, add as needed) |
- Click OK
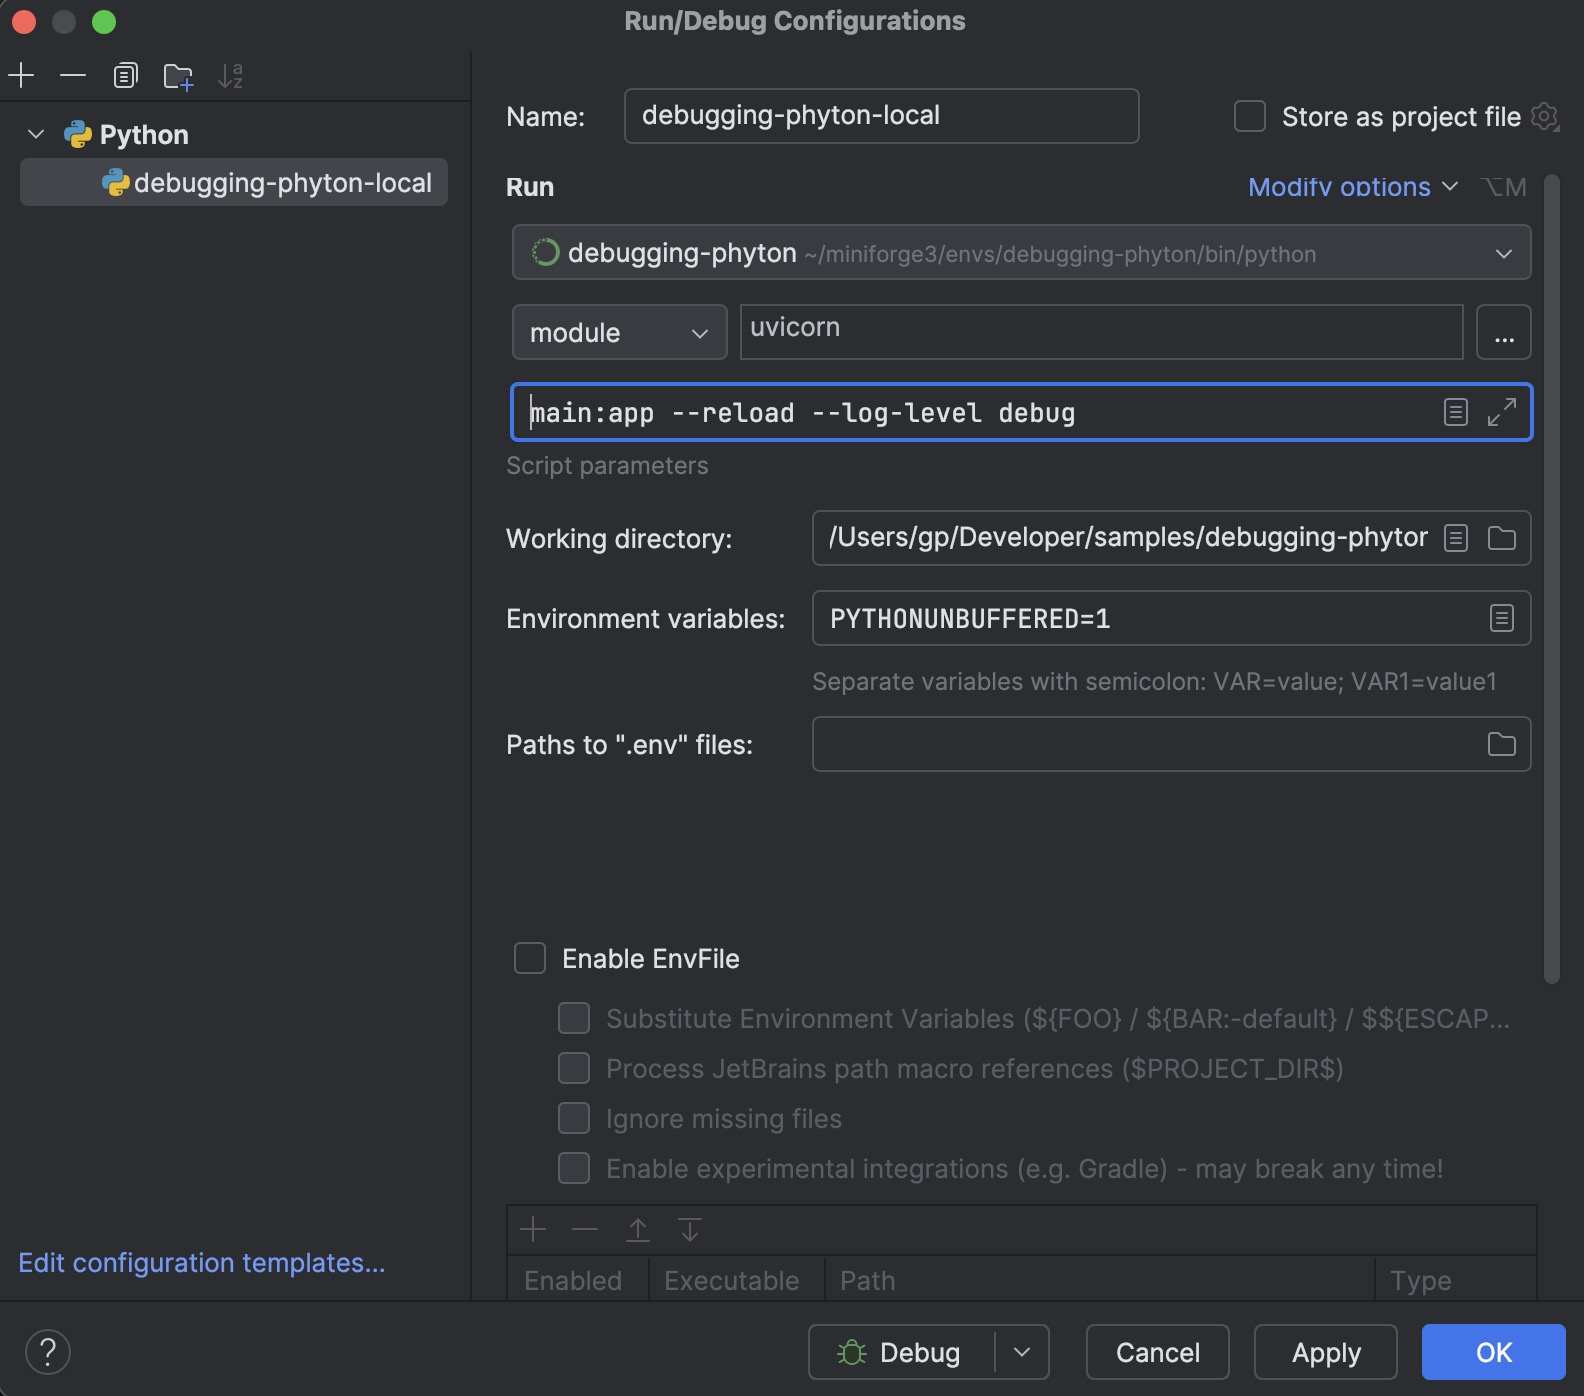 Python Run/Debug Configuration
2.4 Using the Debugger Like a Pro 🔍
Now for the fun part. Let’s debug our DateTime API.
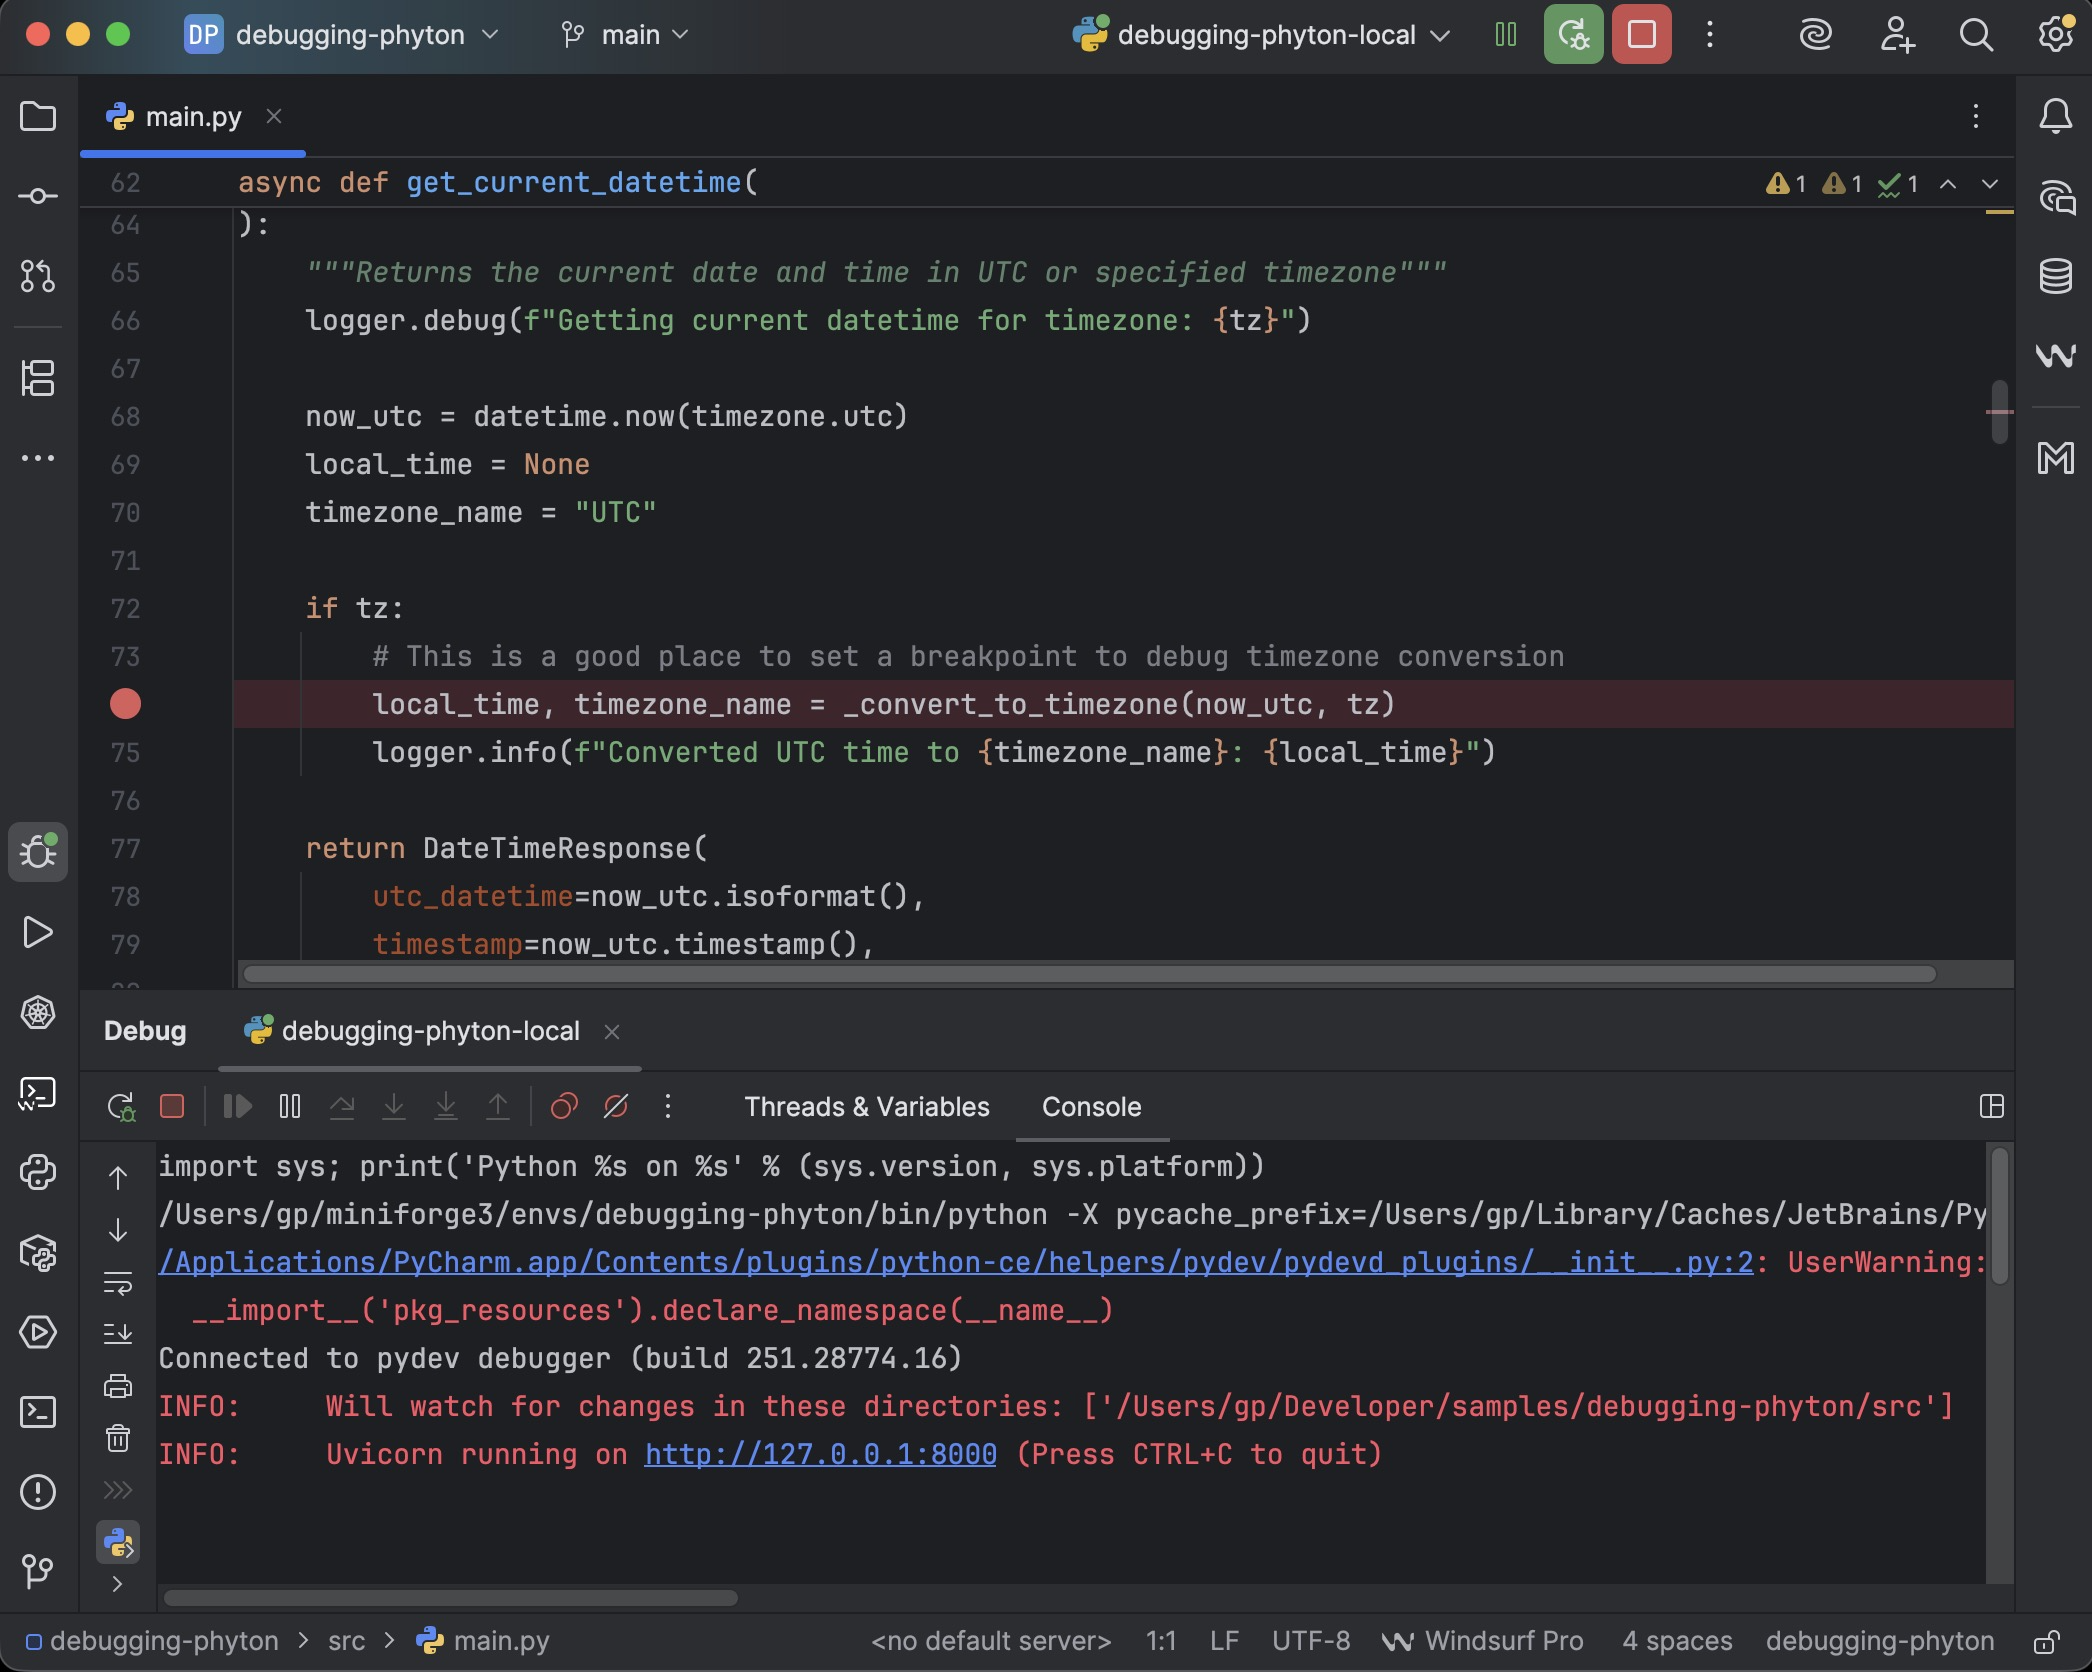
Setting Breakpoints
Open src/main.py and click in the gutter (left margin) next to line 74:
1
local_time, timezone_name = _convert_to_timezone(now_utc, tz)
A red dot appears. This is your breakpoint.
Starting a Debug Session
Click the Debug icon next to your configuration dropdown
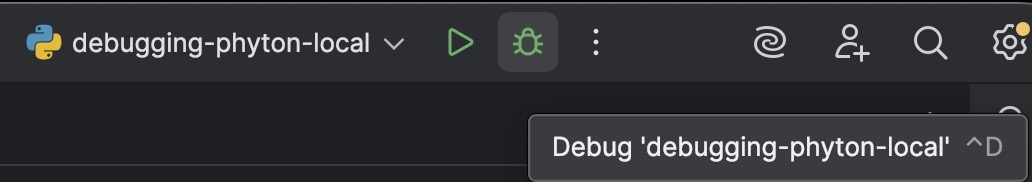 Debug Icon
- Or: Run → Debug ‘datetime-api-local’
- The Debug tool window opens at the bottom
Making a Request
Open another terminal and make a request:
1
curl "http://localhost:8000/datetime?tz=EST"
PyCharm immediately suspends execution at line 74! 🎉
The Debug Window
You’ll see several tabs:
Debugger Tab:
- Frames: Call stack showing how you got here
- Variables: All local variables in the current scope
- Expand
tz→ you’ll see"EST" - Expand
now_utc→ see the datetime object internals
- Expand
Console Tab:
- Interactive Python console in the current debugging context
- Try:
now_utc.timestamp()and press Enter
Stepping Through Code
Use the stepping toolbar at the top of the Debug window:
| Button | Shortcut | Action |
|---|---|---|
| Step Over | F8 | Execute current line, move to next line |
| Step Into | F7 | Go into the function call |
| Step Into My Code | ⌥⇧F7 | Like Step Into, but skips library code |
| Step Out | ⇧F8 | Finish current function and return to caller |
| Resume | ⌘⌥R | Continue until next breakpoint |
Let’s practice:
- Press
F7(Step Into) at line 74 - You’ll jump into the
_convert_to_timezone()function at line 199 - Hover over variables to see their values inline
- Press
F8repeatedly to step through the conversion logic - Watch
offset_hoursget assigned fromTIMEZONE_OFFSETS - Watch
local_dtget calculated
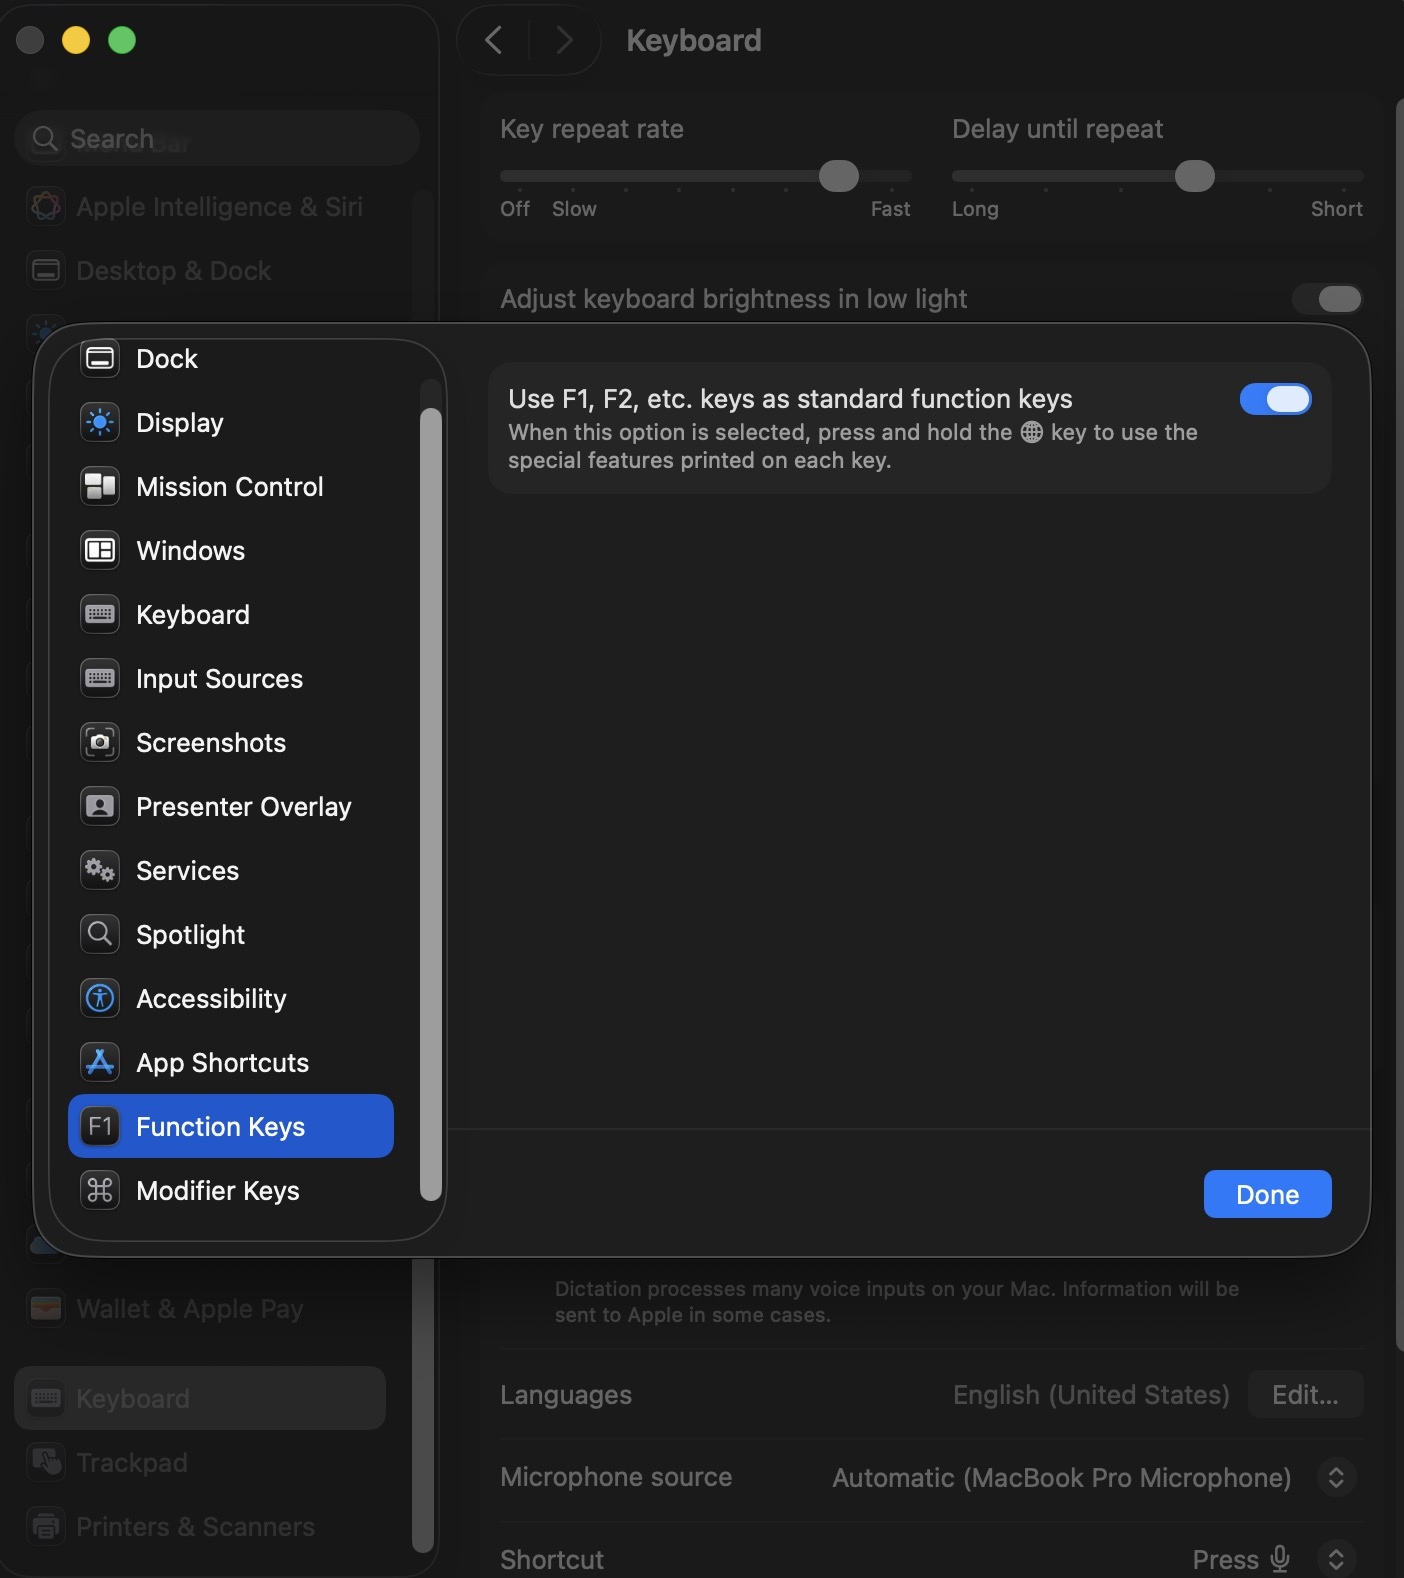
To use F1, F2, etc. keys as standard function keys in System Settings → Keyboard → Keyboard Shortcuts → Function Keys. Temporarily invert behavior by holding fn / globe while pressing the keys.
Advanced Debugging Features
Watches: Add expressions to track across frames
- Right-click in the Variables pane → New Watch
- Enter:
offset_hours * 3600(offset in seconds) - This watch persists across debugging sessions
Evaluate Expression (⌥F8):
- While paused at line 213, press
⌥F8 - In the debugger switch to the
consoleconsole tab - Type:
local_dt.strftime('%Y-%m-%d %H:%M:%S') - Press Enter to see the formatted result
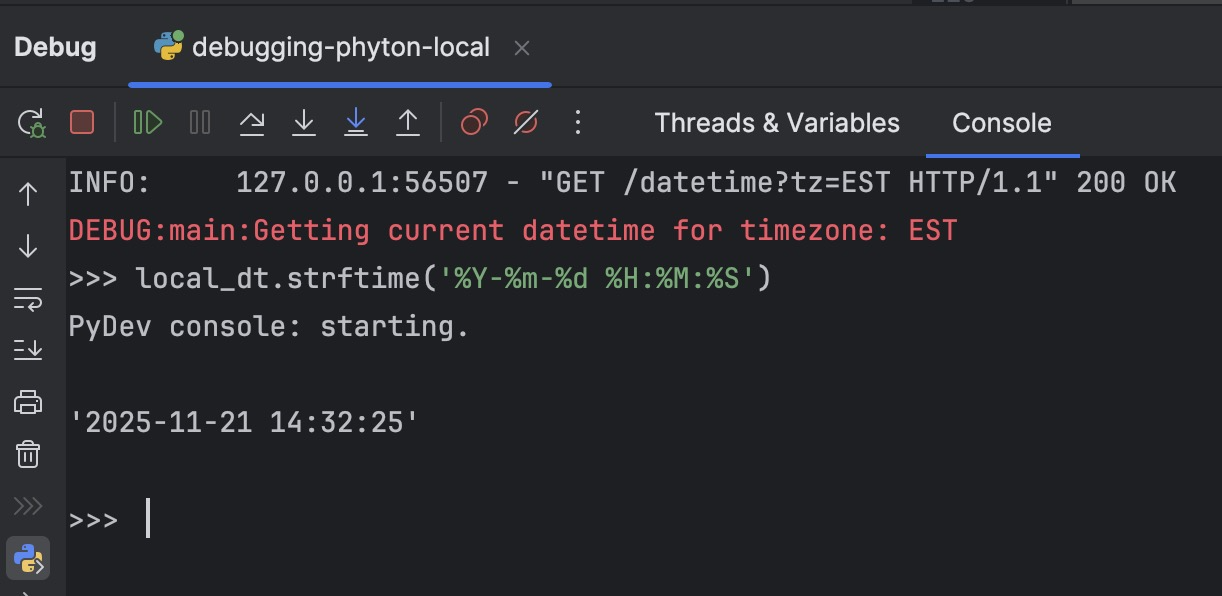 result
Inline Debugging: Variables appear as gray italic text next to code lines. Over on it and select Add as inline watch 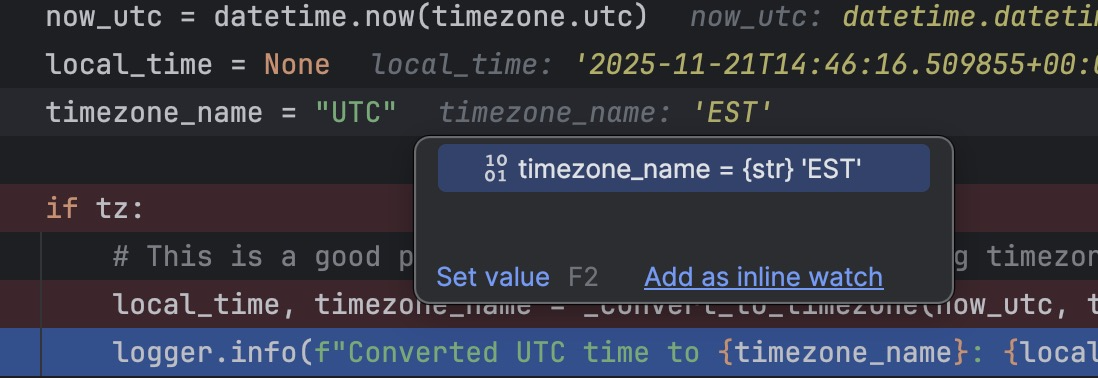 inline watch
2.5 PyCharm Debugger Settings
Go to Settings → Build, Execution, Deployment → Debugger → Python:
Useful settings:
- ☑️ Attach to subprocess automatically: Essential if your code spawns child processes
- ☑️ Gevent compatible: Required for gevent-monkeypatched async code
- ☑️ PyQt compatible: If using PyQt/PySide
For pytest debugging:
- ☑️ Drop into debugger on failed tests: Automatically breaks at failing assertions
3. Advanced Local Debugging Patterns 🚀
3.1 Debugging Async Code (FastAPI/Uvicorn)
Our FastAPI endpoints are async. Set a breakpoint inside an async function:
1
2
3
4
5
6
7
@app.get("/datetime/convert", response_model=TimezoneConversion)
async def convert_timezones(
    time_str: str = Query(..., description="ISO format datetime string"),
    timezones: str = Query("EST,PST,CET", description="Comma-separated timezone codes"),
):
    logger.debug(f"Converting time {time_str} to timezones: {timezones}")
    # Set breakpoint here ⬅️
Test it:
1
curl "http://localhost:8000/datetime/convert?time_str=2024-11-21T10:00:00Z&timezones=EST,PST,JST"
The debugger works perfectly with async/await. You can step through:
- The await points
- Helper function calls
- Exception handlers
3.2 Debugging Complex Logic
The _check_if_business_hours() function has interesting branching logic. Set a breakpoint at line 240:
1
is_business_hours = start_hour <= current_decimal_hour < end_hour
Make a request:
1
curl "http://localhost:8000/business-hours?tz=EST&start_hour=9&end_hour=17"
Now step through and observe:
- How
current_decimal_houris calculated - Which branch executes (before, during, or after business hours)
- How
hours_until_openorhours_until_closeis computed
This is where PyCharm’s debugger shines—you see exactly how your logic flows.
3.3 Conditional Breakpoints
Right-click on a breakpoint → Edit Breakpoint:
Add a condition: tz == "EST"
Now the breakpoint only triggers for EST timezone requests. Perfect for hunting down timezone-specific bugs.
3.4 Exception Breakpoints
Go to Run → View Breakpoints (⌘⇧F8)
Click + → Python Exception Breakpoints
Add: ValueError
Now if any ValueError occurs anywhere in your code, the debugger will break at the exact line that raised it.
Try triggering it:
1
curl "http://localhost:8000/datetime/convert?time_str=invalid-date&timezones=EST"
PyCharm breaks at line 98 where ValueError is raised! 🎯
4. Docker Integration: Bridging Local and Container 🐳
Now let’s move to Docker. First, ensure Docker Desktop is running.
4.1 Enable Docker Support in PyCharm
- Settings (
⌘,) → Plugins → Verify Docker plugin is enabled (it’s bundled with Pro) - Settings → Build, Execution, Deployment → Docker
- Click + to add a Docker configuration
- Select Docker for Mac
- Verify Connection successful appears
4.2 Understanding Virtual Machine Path Mappings
On macOS, Docker Desktop runs in a lightweight VM. By default, it can mount:
/Users(your home directory)/Volumes/private/tmp
Check this at: Settings → Build, Execution, Deployment → Docker → [your config] → Virtual machine path mappings
As long as your project is under /Users/your-username/, you’re good to go.
5. Method 1: Docker-Based Python Interpreter 🎯
This is the most “PyCharm-native” approach. PyCharm manages the container lifecycle and automatically attaches the debugger.
5.1 Build Your Docker Image First
From terminal:
1
2
cd /path/to/debugging-python
docker build -t debugging-python:latest -f src/Dockerfile src/
Or use the provided build script:
1
2
chmod +x deployment/build.sh
./deployment/build.sh
5.2 Create a Docker-Based Interpreter
- Settings (
⌘,) → Project: debugging-python → Python Interpreter - Click the gear icon ⚙️ → Add Interpreter → On Docker…
- Choose Pull or use existing
- Select your Docker configuration (Docker for Mac)
- Image name:
debugging-python:latest - Click Next
PyCharm will:
- Inspect the image
- Detect Python location
- Create a “target” that represents this Docker environment
- Click Create
5.3 Configure Run/Debug for Docker Interpreter
- Run → Edit Configurations…
- Click + → Python
- Name:
datetime-api-docker
| Field | Value |
|---|---|
| Module name | uvicorn |
| Parameters | main:app --host 0.0.0.0 --port 8000 --reload --log-level debug |
| Working directory | /app |
| Python interpreter | Select your Docker interpreter (datetime-api:latest) |
| Path mappings | <Project root>/src=/app (PyCharm usually auto-detects this) |
| Docker container settings | Click “Modify options” → “Docker container settings” |
| Port bindings | 8000:8000 |
| Volume bindings | <Project root>/src:/app |
- Click OK
5.4 Debugging in Docker
Now the magic happens:
- Set a breakpoint at line 106 in
src/main.py:1
for tz in tz_list: # Set breakpoint here
- Click Debug 🐛 with the
datetime-api-dockerconfiguration
PyCharm will:
- Start a container from your image
- Mount your source code as a volume
- Run uvicorn inside the container
- Attach the debugger automatically
- Make a request:
1
curl "http://localhost:8000/datetime/convert?time_str=2024-11-21T10:00:00Z&timezones=EST,PST,JST"
PyCharm breaks at your breakpoint inside the Docker container! 🎉
From your perspective, it looks identical to local debugging, but:
- Your code is running in a Linux container
- The environment matches your production setup
- Dependencies are isolated
5.5 Debugging Tips for Docker Interpreter
Logs: All container stdout/stderr appears in PyCharm’s Debug console
Environment Variables: Add them in the Run Configuration’s “Environment variables” field
Volume Sync: Changes you make in PyCharm are immediately reflected in the container (hot reload works!)
Performance: First run is slow (container startup), subsequent debug sessions are faster
6. Method 2: Docker Compose as Interpreter 🎼
For multi-service applications, Docker Compose is the way to go.
6.1 Understanding Our docker-compose.yml
Our project includes docker-compose.yml:
1
2
3
4
5
6
7
8
9
10
11
12
13
14
15
version: '3.8'

services:
  datetime-api:
    build:
      context: ./src
      dockerfile: Dockerfile
    container_name: datetime-api
    ports:
      - "8000:8000"
    volumes:
      - ./src:/app
    environment:
      - PYTHONUNBUFFERED=1
    command: ["uvicorn", "main:app", "--host", "0.0.0.0", "--port", "8000", "--reload", "--log-level", "debug"]
Key points:
- volumes: Maps
./src→/appin the container (live code sync) - ports: Exposes port 8000
- command: Explicit uvicorn command with
--reload
6.2 Create Docker Compose Interpreter
- Settings → Project: codechallenge → Python Interpreter
- Click ⚙️ → Add Interpreter → On Docker Compose…
- Choose:
- Server: Docker for Mac
- Configuration files:
./docker-compose.yml - Service:
datetime-api - Python interpreter path:
/usr/local/bin/python(or auto-detected)
- Click Create
PyCharm will:
- Parse your
docker-compose.yml - Use the
datetime-apiservice as the interpreter - Understand volume mappings automatically
6.3 Create Run/Debug Configuration for Compose
- Run → Edit Configurations…
- Click + → Python
- Name:
datetime-api-compose
| Field | Value |
|---|---|
| Module name | uvicorn |
| Parameters | main:app --host 0.0.0.0 --port 8000 --reload --log-level debug |
| Working directory | /app |
| Python interpreter | Select the Docker Compose interpreter (datetime-api service) |
- Click OK
6.4 Debugging with Docker Compose
- Set a breakpoint at line 140 in the
check_business_hours()function - Click Debug 🐛 with
datetime-api-compose
PyCharm:
- Runs
docker-compose upwith your service - Starts any dependent services (if you had them)
- Attaches debugger to the
datetime-apicontainer
- Test:
1
curl "http://localhost:8000/business-hours?tz=PST&start_hour=9&end_hour=17"
Debugging works exactly like before, but now:
- Your entire multi-service stack is running
- Dependencies (databases, caches, etc.) are available
- It’s closer to your real deployment environment
6.5 Debugging Multi-Service Stacks
If you later add a database or message queue:
1
2
3
4
5
6
7
8
9
10
11
12
13
services:
  datetime-api:
    # ... existing config ...
    depends_on:
      - postgres

  postgres:
    image: postgres:15-alpine
    environment:
      POSTGRES_USER: dev
      POSTGRES_PASSWORD: devpass
    ports:
      - "5432:5432"
PyCharm will bring up both services when you debug. The API can connect to postgres:5432 inside the Docker network.
7. Method 3: Attaching to Running Containers with Debug Server 🔌
Sometimes you can’t let PyCharm control the container:
- You start containers via Makefile/scripts
- You’re debugging in a CI/CD environment
- You need to attach to an already-running production-like setup
Enter: Python Debug Server + pydevd-pycharm.
7.1 How It Works
- PyCharm starts a Debug Server listening on a port (e.g., 5678)
- Your Python code inside the container connects back to PyCharm via
pydevd_pycharm.settrace() - Once connected, debugging works normally
7.2 Update Dockerfile for Remote Debugging
We need pydevd-pycharm installed in the image. Update src/Dockerfile:
1
2
3
4
5
6
7
8
9
10
11
12
13
14
15
16
17
18
19
20
21
22
23
# Use Python 3.11 slim image
FROM python:3.11-slim

# Set working directory
WORKDIR /app

# Copy requirements file
COPY requirements.txt .

# Install dependencies
RUN pip install --no-cache-dir -r requirements.txt

# Install PyCharm remote debugger (match your PyCharm version)
RUN pip install pydevd-pycharm~=251.28774

# Copy application code
COPY main.py .

# Expose port 8000 for API and 5678 for debugger
EXPOSE 8000 5678

# Run the application
CMD ["uvicorn", "main:app", "--host", "0.0.0.0", "--port", "8000", "--log-level", "debug"]
Important: The
pydevd-pycharmversion should match your PyCharm build. Check PyCharm → About PyCharm for your build number.
Rebuild:
1
docker build -t debugging-python:debug -f src/Dockerfile src/
7.3 Add Debug Hook to Your Code
At the top of src/main.py, add after imports:
1
2
3
4
5
6
7
8
9
10
11
12
import os

# Remote debugging hook for PyCharm
if os.getenv("PYCHARM_DEBUG", "0") == "1":
    import pydevd_pycharm
    pydevd_pycharm.settrace(
        'host.docker.internal',  # macOS Docker Desktop magic hostname
        port=5678,
        stdoutToServer=True,
        stderrToServer=True,
        suspend=False,  # Set to True to break immediately on connection
    )
Explanation:
host.docker.internal: Docker Desktop’s special hostname that resolves to your Mac (the host)port=5678: Must match PyCharm’s Debug Server portsuspend=False: Don’t pause immediately; wait for breakpoints
7.4 Create Python Debug Server Configuration
- Run → Edit Configurations…
- Click + → Python Debug Server
- Name:
docker-remote-debug
| Field | Value |
|---|---|
| IDE host name | localhost (PyCharm’s perspective) |
| Port | 5678 |
| Path mappings | Click “+” and add: Local: /Users/your-username/.../codechallenge/srcRemote: /app |
- Click OK
7.5 Debugging Workflow
Step 1: Start PyCharm Debug Server
- Select
docker-remote-debugconfiguration - Click Debug 🐛
- PyCharm shows:
Waiting for process connection...
Step 2: Start Your Docker Container
1
2
3
4
5
6
7
docker run -d \
  --name datetime-api-debug \
  -p 8000:8000 \
  -p 5678:5678 \
  -v "$(pwd)/src:/app" \
  -e PYCHARM_DEBUG=1 \
  datetime-api:debug
Or use the debug compose file:
1
docker-compose -f docker-compose.debug.yml up -d
Step 3: Watch the Connection
PyCharm console shows:
1
Connected to pydev debugger (build 242.23726)
Success! 🎉
Step 4: Set Breakpoints and Debug
- Set a breakpoint anywhere in
main.py - Make an API request:
1
curl "http://localhost:8000/datetime?tz=CET"
PyCharm breaks at your breakpoint, even though the container was started manually!
7.6 When to Use This Method
✅ Use Debug Server when:
- You have complex container orchestration (Kubernetes, docker-compose stacks)
- Containers are started by CI/CD or external scripts
- You’re debugging in staging/production-like environments
- You need to attach to a specific long-running process
❌ Don’t use it when:
- Simple single-container apps (use Docker interpreter instead)
- You have full control over container lifecycle (use Compose interpreter)
8. Troubleshooting Common Issues 🔧
8.1 Breakpoints Don’t Hit in Docker
Symptom: You set breakpoints, but execution never pauses.
Checklist:
✅ Wrong interpreter: Ensure your Run/Debug config uses the Docker/Compose interpreter, not the local conda env
✅ Path mismatch: Verify path mappings. Your local /Users/.../codechallenge/src must map to /app in the container
Check: Run → Edit Configurations → [your config] → Path mappings
✅ Code mismatch: If you baked code into the image but also mount it as a volume, ensure WORKDIR and PYTHONPATH point to the mounted path, not the baked one
✅ Debugger not attached: For Debug Server method, verify PyCharm shows “Connected to pydev debugger”
Fix: Add print("Startup OK") in main.py startup code. If you see it in logs, code is running but debugger isn’t attached.
8.2 “Could not connect to host.docker.internal:5678”
Symptom (in container logs):
1
ConnectionRefusedError: [Errno 61] Connection refused
Causes & Fixes:
Debug Server not running: Start the
docker-remote-debugconfiguration in PyCharm firstPort mismatch: Verify
settrace(port=5678)matches your Debug Server configDocker networking issue (rare): Restart Docker Desktop
Test connectivity from inside container:
1
docker exec -it datetime-api-debug ping host.docker.internal
If ping fails, Docker Desktop’s networking is broken. Restart it.
8.3 Debugging is Extremely Slow
Causes:
Too many watches/complex evaluations: Remove unnecessary watches. Evaluating large objects can slow stepping.
Cython speedup missing: PyCharm’s debugger has optional Cython extensions for speed. If you see a warning on first debug run, follow the suggestion to compile them.
To disable Cython (useful if compilation fails):
- Add environment variable in Run/Debug config:
PYDEVD_USE_CYTHON=NO
- Volume mount performance (macOS): Docker Desktop’s file sync can be slow. For huge projects, consider:
- Using
:cachedflag:-v "$(pwd)/src:/app:cached" - Or sync files into the image (less convenient for debugging)
- Using
8.4 Import Errors / Module Not Found
Symptom: Code runs locally but fails in Docker with ModuleNotFoundError.
Fix:
Verify all dependencies are in
requirements.txtand installed in the imageCheck working directory in Run/Debug config matches
WORKDIRin DockerfileVerify volume mounts are correct:
1
2
docker exec -it datetime-api ls /app
# Should show: main.py, requirements.txt, etc.
8.5 Environment Variables Not Available
Symptom: os.getenv("SOME_VAR") returns None in Docker but works locally.
Fix:
For Docker Interpreter:
- Add env vars in Run/Debug config: Environment variables field
- Format:
KEY1=value1;KEY2=value2
For Docker Compose:
- Add to
docker-compose.ymlunderenvironment:```yaml environment:- SOME_VAR=some_value
- ANOTHER_VAR=another_value ```
For Debug Server:
- Add to
docker run -eor docker-composeenvironment:
8.6 PyCharm Can’t Find Docker
Symptom: “Cannot connect to Docker daemon”
Fix:
Ensure Docker Desktop is running (whale icon in menu bar)
Test from terminal:
1
docker ps
If it works in terminal but not in PyCharm:
Restart PyCharm
Re-add Docker connection: Settings → Docker → + → Docker for Mac
9. Best Practices & Workflow Recommendations 💡
9.1 Tiered Debugging Strategy
Use the right tool for the job:
Tier 1: Local conda environment
- ✅ Fast iteration on business logic
- ✅ No Docker overhead
- ✅ Use for: unit tests, algorithm development, quick feature work
Tier 2: Docker Compose interpreter
- ✅ Real container environment
- ✅ Multi-service integration
- ✅ Use for: API integration testing, debugging service interactions
Tier 3: Debug Server (remote attach)
- ✅ Complex orchestration scenarios
- ✅ Production-like environments
- ✅ Use for: “Why does this fail only in this specific environment?”
9.2 Conditional Debug Hooks
Instead of hardcoding settrace(), use environment variables:
1
2
3
4
5
6
7
8
9
10
11
12
13
14
15
import os

if os.getenv("PYCHARM_DEBUG") == "1":
    try:
        import pydevd_pycharm
        pydevd_pycharm.settrace(
            os.getenv("DEBUG_HOST", "host.docker.internal"),
            port=int(os.getenv("DEBUG_PORT", "5678")),
            stdoutToServer=True,
            stderrToServer=True,
            suspend=False,
        )
        print("🐛 Connected to PyCharm debugger")
    except Exception as e:
        print(f"⚠️ Failed to connect to debugger: {e}")
This way:
- In local dev:
PYCHARM_DEBUG=0(no debug server needed) - In Docker debug mode:
PYCHARM_DEBUG=1 - In production: Variable not set (no debug overhead)
9.3 Named Configurations for Everything
Create separate Run/Debug configs for each scenario:
datetime-api-local(conda, local testing)datetime-api-docker(Docker interpreter)datetime-api-compose(Docker Compose)docker-remote-debug(Debug Server)pytest-local(local unit tests)pytest-docker(tests in Docker)
This makes switching contexts instant.
9.4 Use Logging Strategically
Don’t rely solely on breakpoints. Add strategic logging:
1
2
3
4
logger.debug(f"Processing timezone conversion: {tz_code}")
logger.info(f"Successful conversion to {tz_code}: {result}")
logger.warning(f"Unknown timezone requested: {tz_code}")
logger.error(f"Conversion failed: {e}", exc_info=True)
Benefits:
- Logs persist after debugging sessions
- See flow even when not debugging
- Easier to debug intermittent issues
9.5 Exception Breakpoints for “WTF” Moments
When you get an exception but don’t know where it’s coming from:
- Run → View Breakpoints (
⌘⇧F8) - Add Python Exception Breakpoint for the exception type
- Run in debug mode
- PyCharm breaks at the exact line that raises it
This is invaluable for:
- Third-party library exceptions
- Async code exceptions
- Deeply nested call stacks
9.6 Keep Path Mappings Consistent
Always use the same paths:
- Docker WORKDIR:
/app - Volume mount:
./src:/app - Working directory in configs:
/app
This consistency prevents 90% of “breakpoints don’t work” issues.
10. Real-World Debugging Scenarios with Our DateTime API 🎬
Let’s walk through common debugging scenarios with our DateTime API.
Scenario 1: “Why is my timezone conversion wrong?”
Situation: EST times seem off.
Debug Process:
- Set breakpoint at line 206 in
_convert_to_timezone() - Run:
curl "http://localhost:8000/datetime?tz=EST" - Step through and inspect:
offset_hoursfromTIMEZONE_OFFSETS→ should be-5offset = timedelta(hours=offset_hours)→ creates -5 hour offset- Watch
local_dt = dt + offsetcalculation - Verify the result
Common Issue: Confusing EST (Eastern Standard Time) vs EDT (Eastern Daylight Time). Our simplified example doesn’t handle DST. In production, use pytz or zoneinfo.
Scenario 2: “Business hours calculation is broken”
Situation: The /business-hours endpoint says it’s closed when it should be open.
Debug Process:
- Set breakpoint at line 233 in
_check_if_business_hours() - Make request with specific timezone:
1
curl "http://localhost:8000/business-hours?tz=EST&start_hour=9&end_hour=17" - In the debugger, check:
current_hourandcurrent_minutevaluescurrent_decimal_hourcalculation (e.g., 14:30 → 14.5)- The boolean expression:
start_hour <= current_decimal_hour < end_hour
Add a Watch: f"{start_hour} <= {current_decimal_hour} < {end_hour}"
This helps you see the exact comparison being made.
Scenario 3: “The loop only processes 2 of 3 timezones”
Situation: Converting to “EST,PST,INVALID” only returns EST and PST, not 3 results.
Debug Process:
- Set breakpoint at line 106:
for tz in tz_list: - Request:
1
curl "http://localhost:8000/datetime/convert?time_str=2024-11-21T15:00:00Z&timezones=EST,PST,INVALID" - Step through each loop iteration (F8)
- Watch the Variables panel:
tz_list→['EST', 'PST', 'INVALID']- On iteration 3,
tz='INVALID' - The
if tz not in TIMEZONE_OFFSETS:branch triggers continueskips adding to results
Insight: The logger.warning() call at line 108 should log this. Check your logs!
Scenario 4: “DateTime parsing fails with cryptic error”
Situation: Request with time_str=2024-13-45T99:99:99 gives a vague 400 error.
Debug with Exception Breakpoint:
- Run → View Breakpoints (
⌘⇧F8) - Add Python Exception Breakpoint:
ValueError - Click Debug and make the bad request
PyCharm breaks at line 95:
1
original_dt = datetime.fromisoformat(time_str.replace("Z", "+00:00"))
Variables panel shows:
time_str="2024-13-45T99:99:99"
Now you can see the exact invalid input. Add better error handling:
1
2
3
4
5
6
except ValueError as e:
    logger.error(f"Invalid datetime '{time_str}': {e}")
    raise HTTPException(
        status_code=400,
        detail=f"Invalid datetime format: {time_str}. Use ISO format like 2024-11-21T15:00:00"
    )
11. Conda vs Docker: When to Use Which 🤔
Use Local Conda Environment When:
- ✅ Developing new features (fast iteration)
- ✅ Running unit tests
- ✅ Algorithm exploration and data analysis
- ✅ Your app has no system-level dependencies
Use Docker Debugging When:
- ✅ Testing system-level integrations (file systems, networking)
- ✅ Reproducing production-only bugs
- ✅ Working with multiple services (databases, queues)
- ✅ Verifying deployment behavior
Pro Tip: Use Both
- Write code with conda env (fast!)
- Run unit tests with conda
- Integration test with Docker Compose
- Final verification with Docker before deploying
This workflow combines speed and accuracy.
12. Summary & Key Takeaways 🎯
You now have a complete debugging toolkit for Python development on macOS:
Core Skills Learned:
- ✅ Local conda debugging with PyCharm’s powerful debugger
- ✅ Docker interpreter method for seamless container debugging
- ✅ Docker Compose method for multi-service stacks
- ✅ Remote debug server for advanced scenarios
Remember These Golden Rules:
- 🔑 Path mappings must be correct (local ↔ container)
- 🔑 Use named Run/Debug configurations for each scenario
- 🔑 Combine logging with debugging for best results
- 🔑 Exception breakpoints are your secret weapon
- 🔑 Conditional breakpoints save time on busy endpoints
The Debugging Hierarchy:
1
2
3
4
5
6
7
8
9
Level 1: Breakpoints & step-through
    ↓
Level 2: Watches & expression evaluation
    ↓
Level 3: Conditional & exception breakpoints
    ↓
Level 4: Remote debugging in Docker
    ↓
Level 5: Multi-service Docker Compose debugging
Start simple, escalate as needed.
Next Steps 🚀
- Set up your conda environment for this project
- Create your first Run/Debug configurations
- Practice with the DateTime API endpoints
- Try Docker debugging with the provided Dockerfile
- Experiment with Docker Compose multi-service setups
- Add the remote debug hook for advanced scenarios
Resources & References 📚
- PyCharm Debugging Guide: JetBrains Official Docs
- Docker Integration: PyCharm Docker Support
- Remote Debugging: PyCharm Remote Debug
- FastAPI Documentation: FastAPI Official Docs
- Docker Desktop for Mac: Docker Docs
Feedback & Questions 💬
Mastering debugging is a journey, not a destination. The techniques in this guide will serve you well across any Python project, whether it’s a small script or a large microservices architecture.
Remember: The best debugger is the one you actually use. Start with breakpoints, build from there, and soon you’ll be hunting down bugs like a pro. 🐛🔫
Happy debugging! 🎉
Written with ❤️ for the Python & PyCharm community
Last updated: November 2024
Need Help with Your AI Project?
Whether you’re building a new AI solution or scaling an existing one, I can help. Book a free consultation to discuss your project.