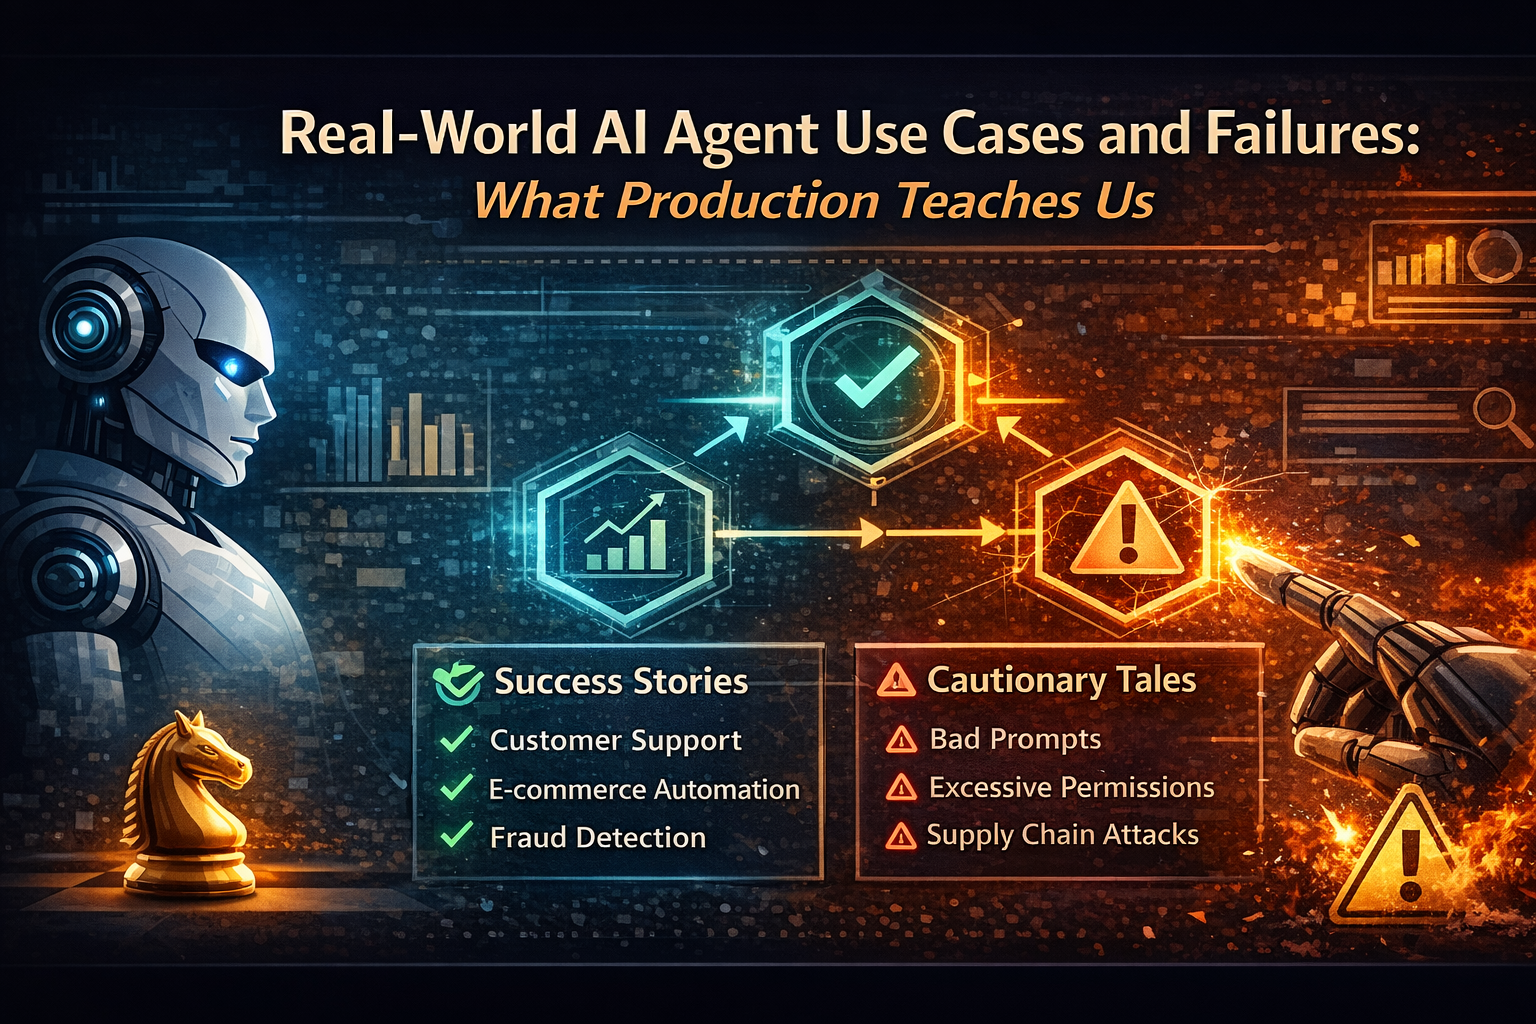
Multi-Agent Orchestration Patterns: Building Collaborative AI Teams
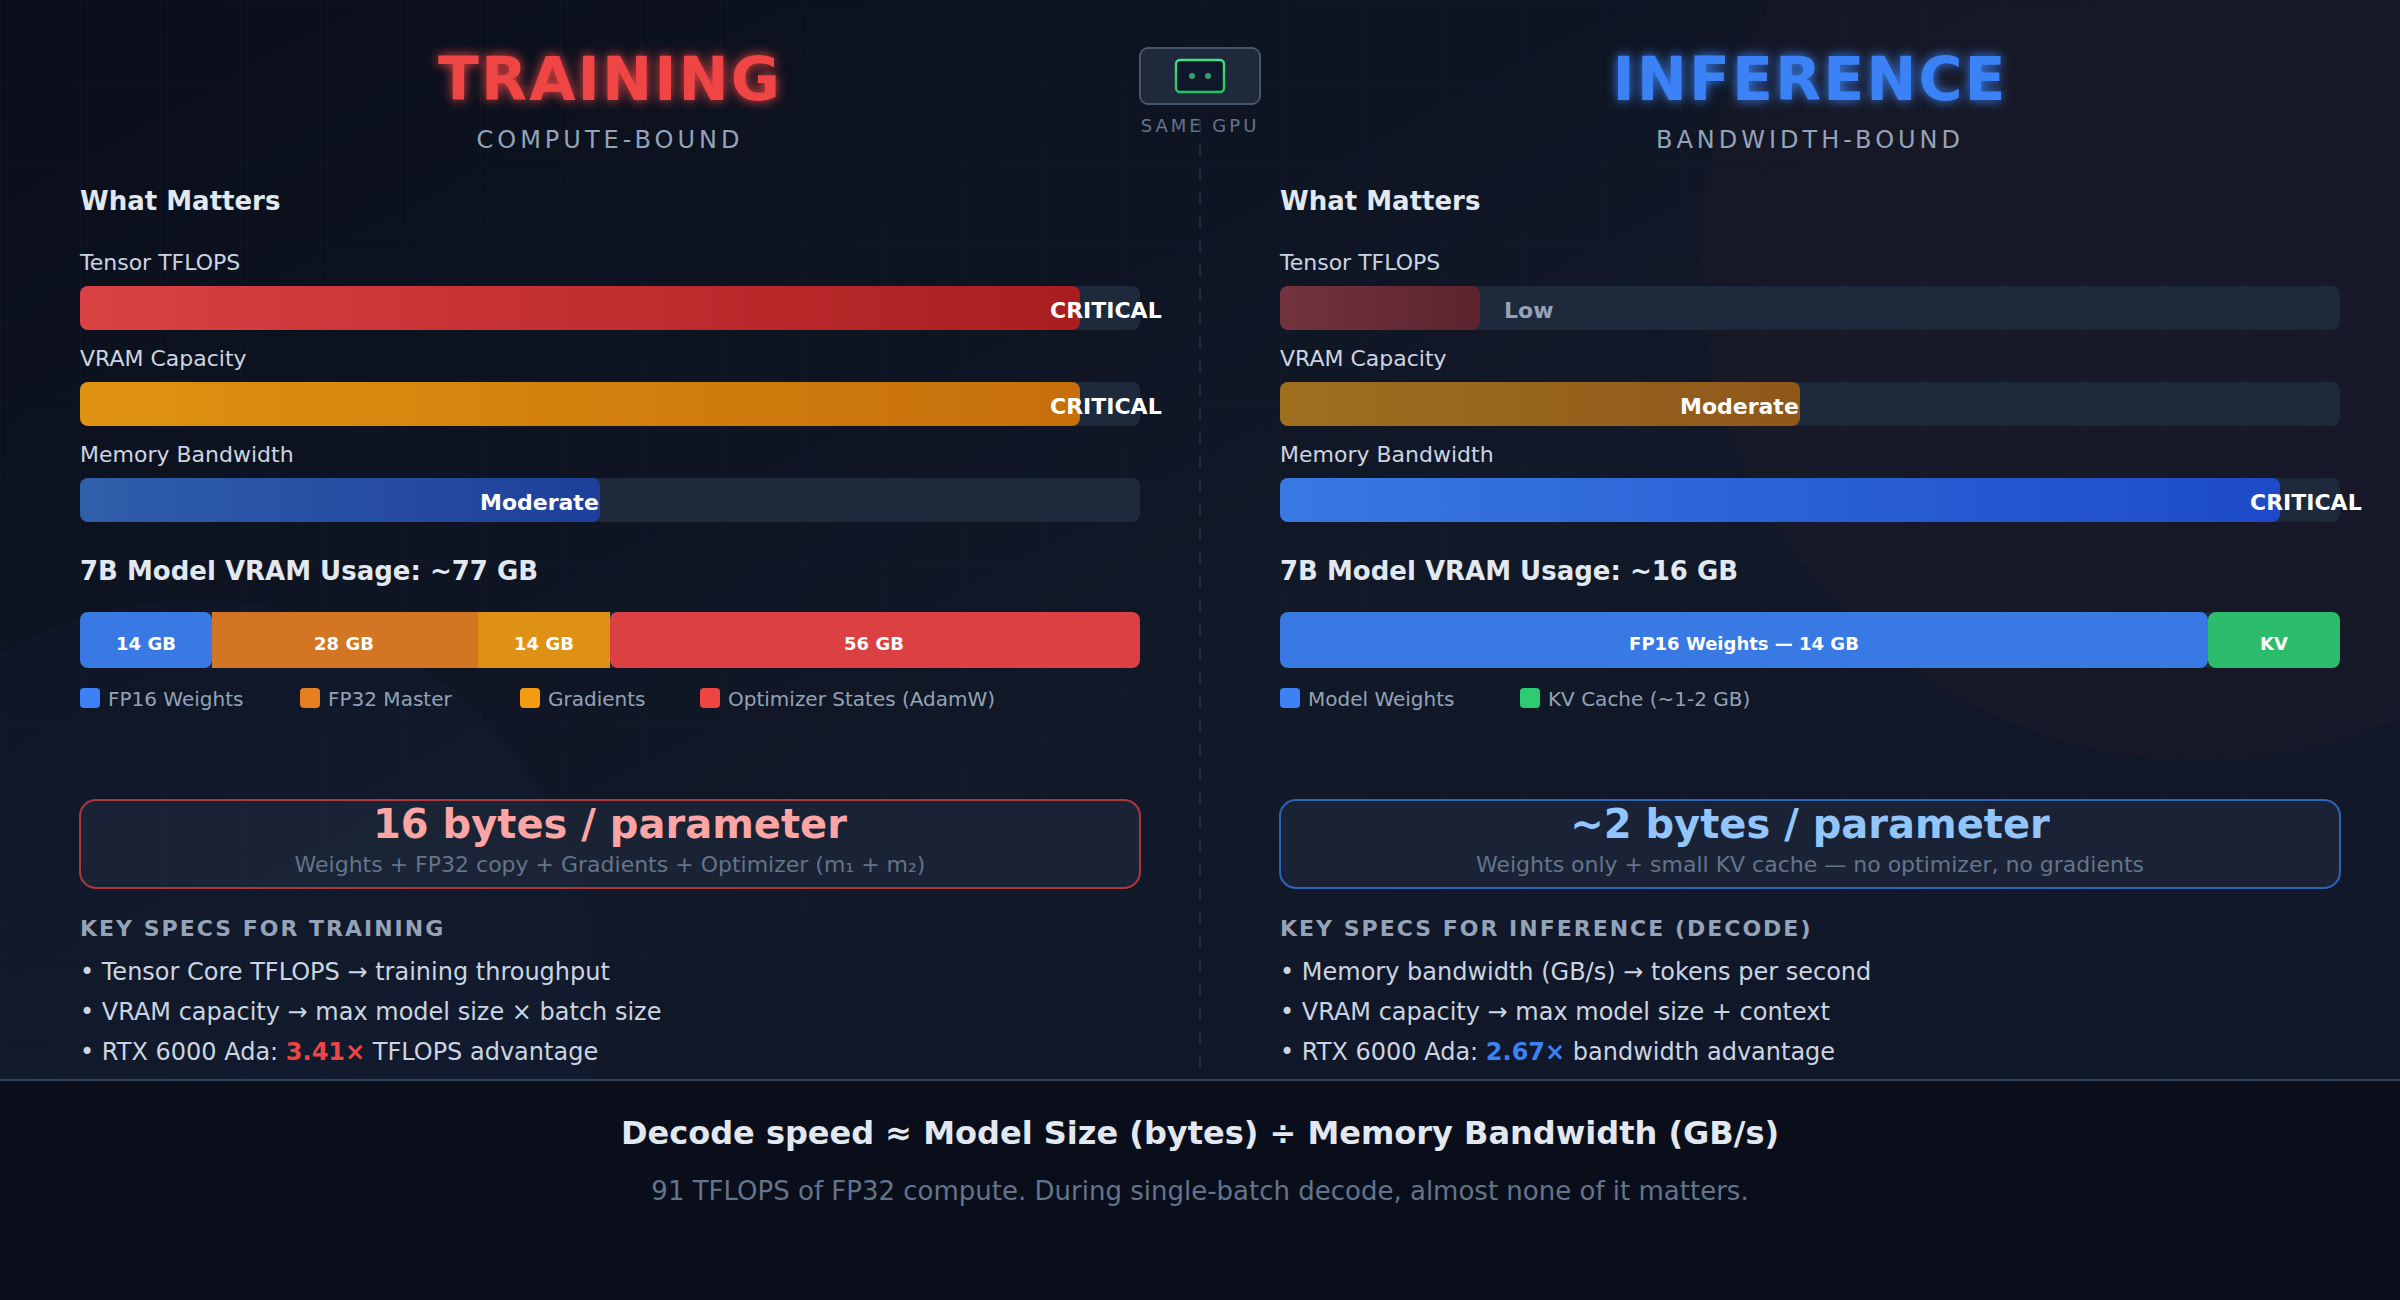
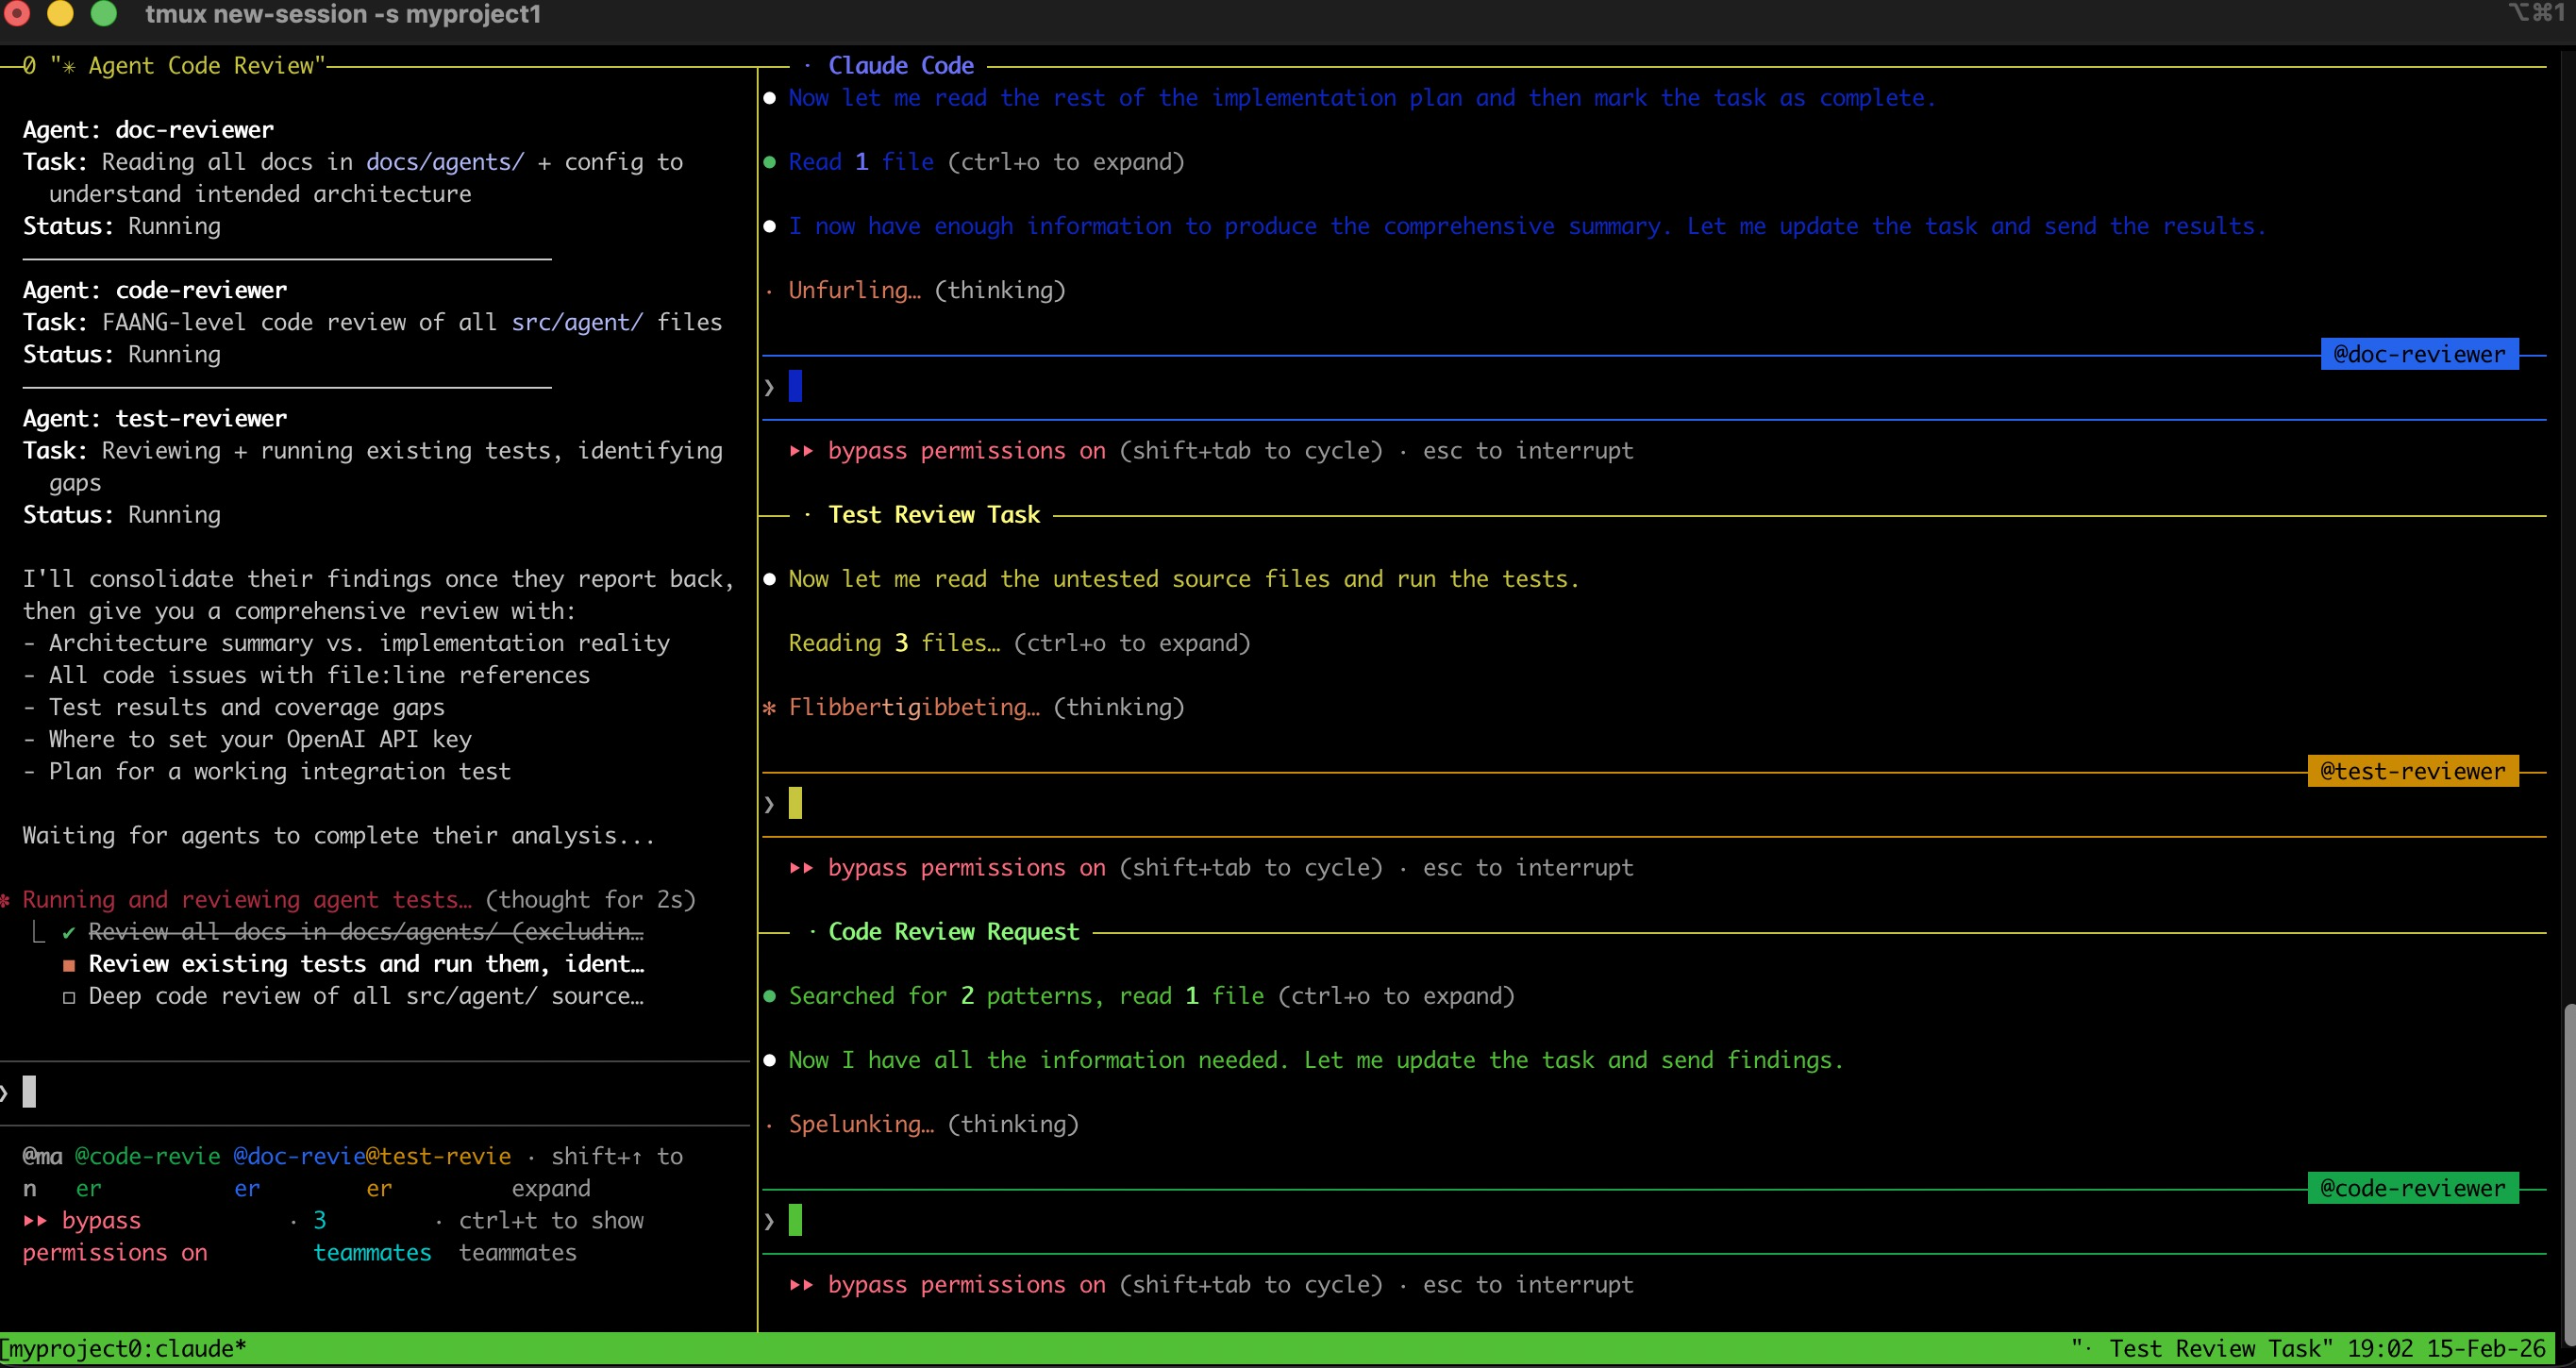
Microsoft just shipped Agent Framework RC — merging AutoGen and Semantic Kernel into one SDK. Production teams are running 5+ specialist agents in parallel for tasks that took a single agent 45 min...